Understanding CPU Limit Metrics in Azure SQL Elastic Pools


I recently encountered a case similar to one I had a couple of years ago, and I decided to write a quick note about it for my blog.
Scenario: A customer has a SQL elastic pool and, in the "Per database settings," they set a maximum of 0.5 vCore for each database.
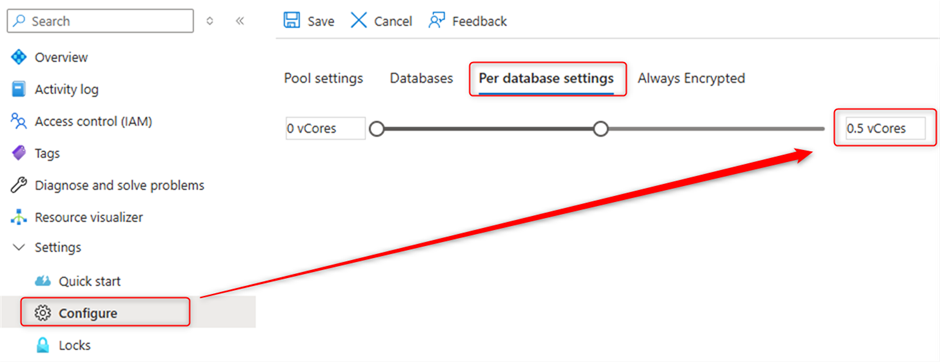
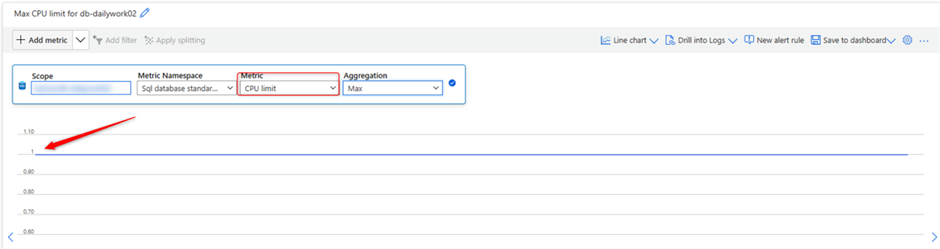
Why does the "metrics" for this database show "1" for "CPU limit"
I configured the same in my test environment. The question is Why does the "metrics" for this database show "1" for "CPU limit" even though the max vCore is set to 0.5?
According to Microsoft's public documentation on Monitoring and performance tuning for Azure SQL Database & Azure SQL Managed Instance, databases with extremely low usage might show in the portal with less than actual usage.
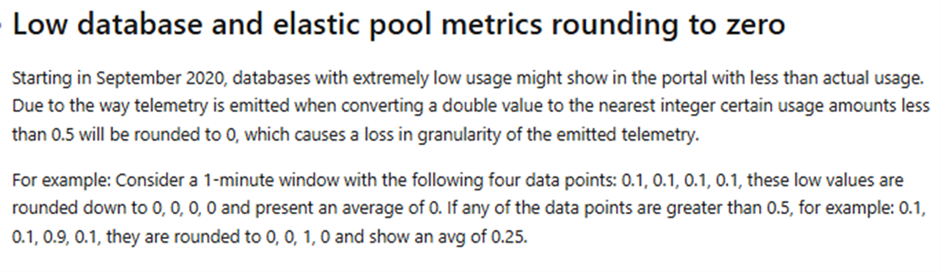
If you have a very small database with low usage, you may see the same behavior in the metrics in the Azure Portal. This is expected and aligns with the documentation provided by Microsoft. By understanding this behavior, you can better interpret the metrics and ensure that your resource configurations are working as intended.
See referral link here https://learn.microsoft.com/en-us/azure/azure-sql/database/monitor-tune-overview?view=azuresql#low-database-and-elastic-pool-metrics-rounding-to-zero